| 1 |
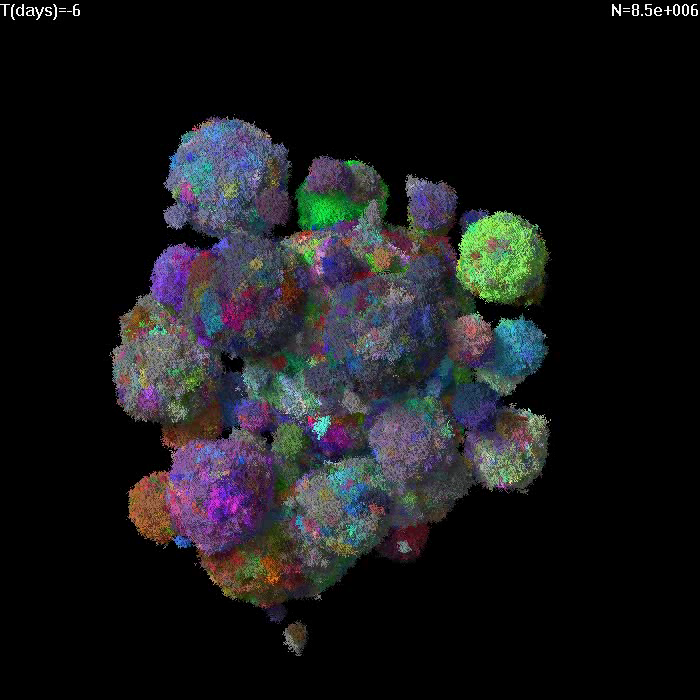 |
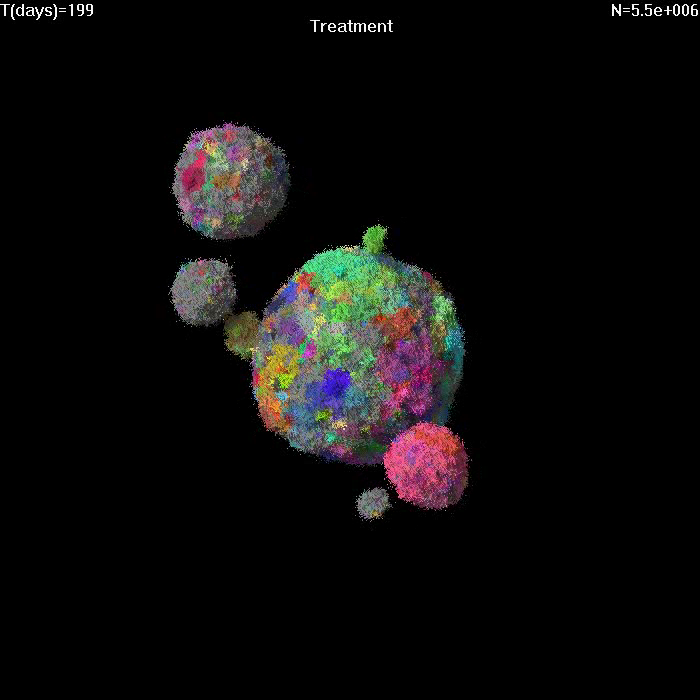
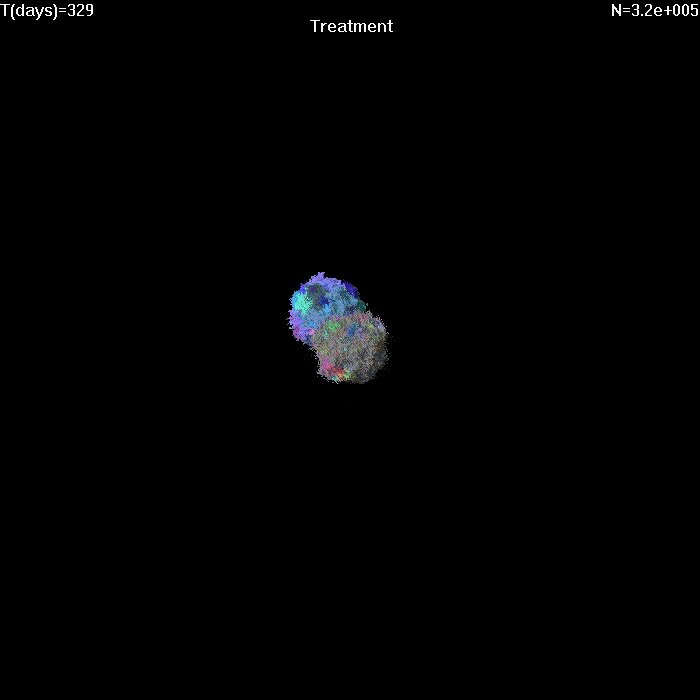
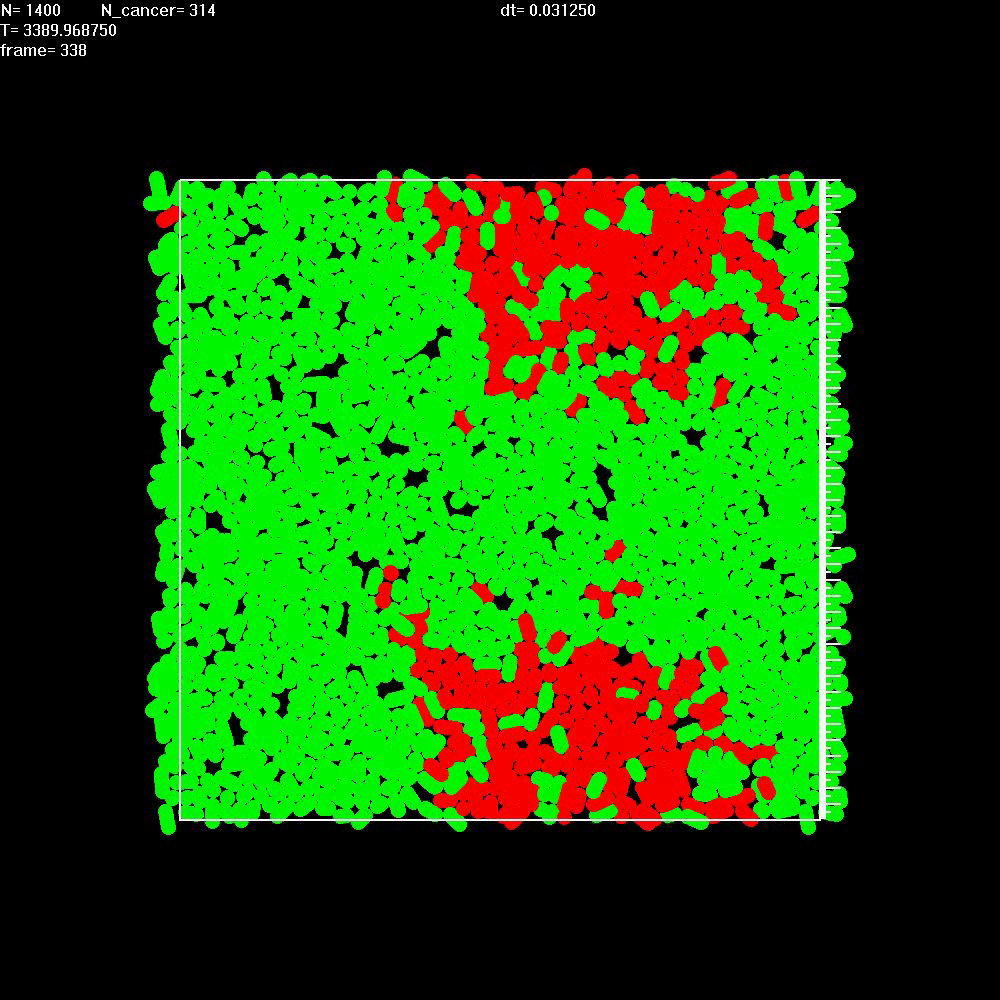
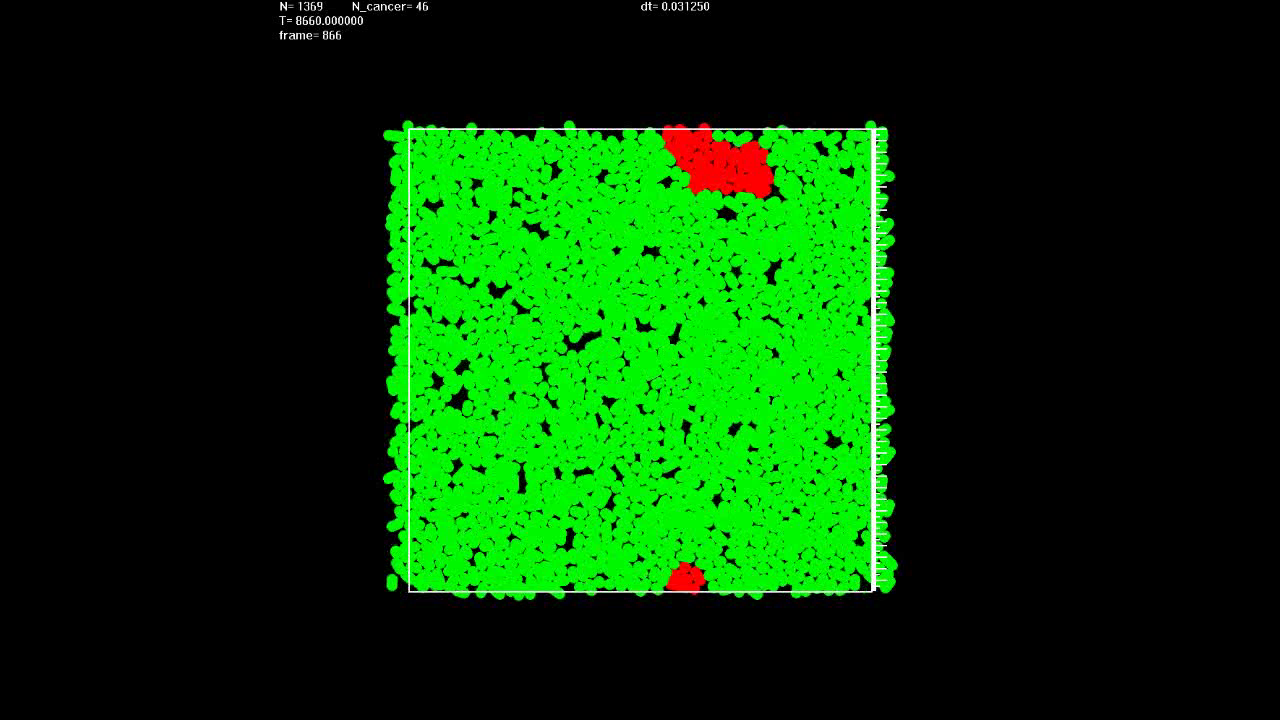
Simulation of growth and treatment of a small tumor (1e7 cells).
Treatment begins at T=0. Different colors correspond to cells with different genetic alterations (GAs). Here migration probability M=1e-6, death rate d=0.5, growth rate b=1. After treatment, sensitive cells have b=0.5, d=1. |
| 2 |
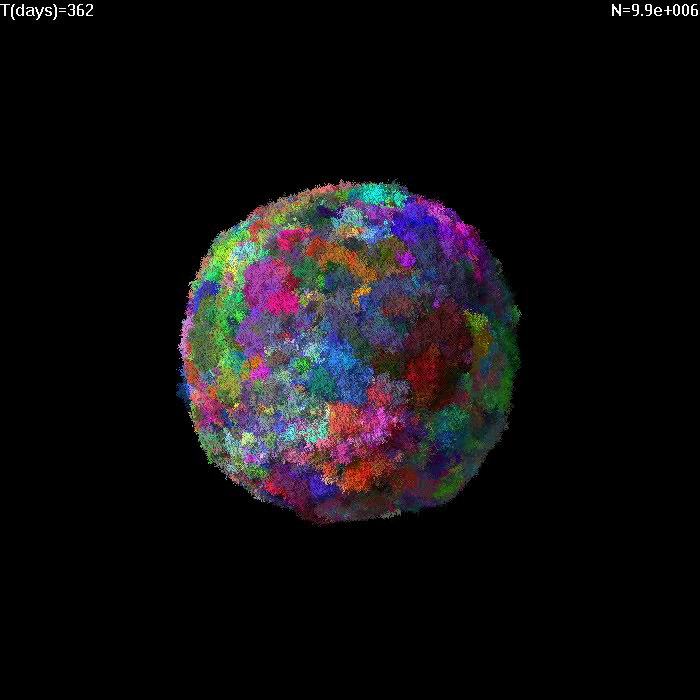 |
Simulation of growth of a small tumor (1e7 cells) with no migration and death rate d=0.5.
Different colors correspond to cells with different GAs. |
| 3 |
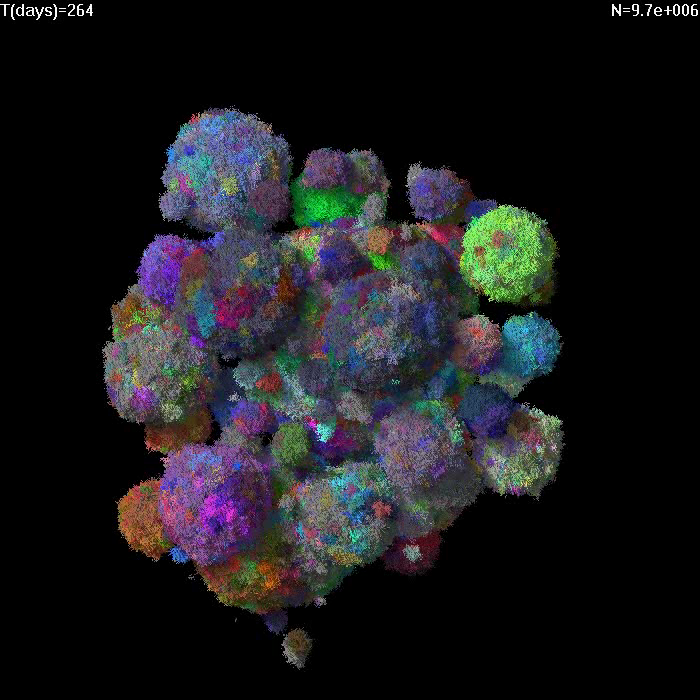 |
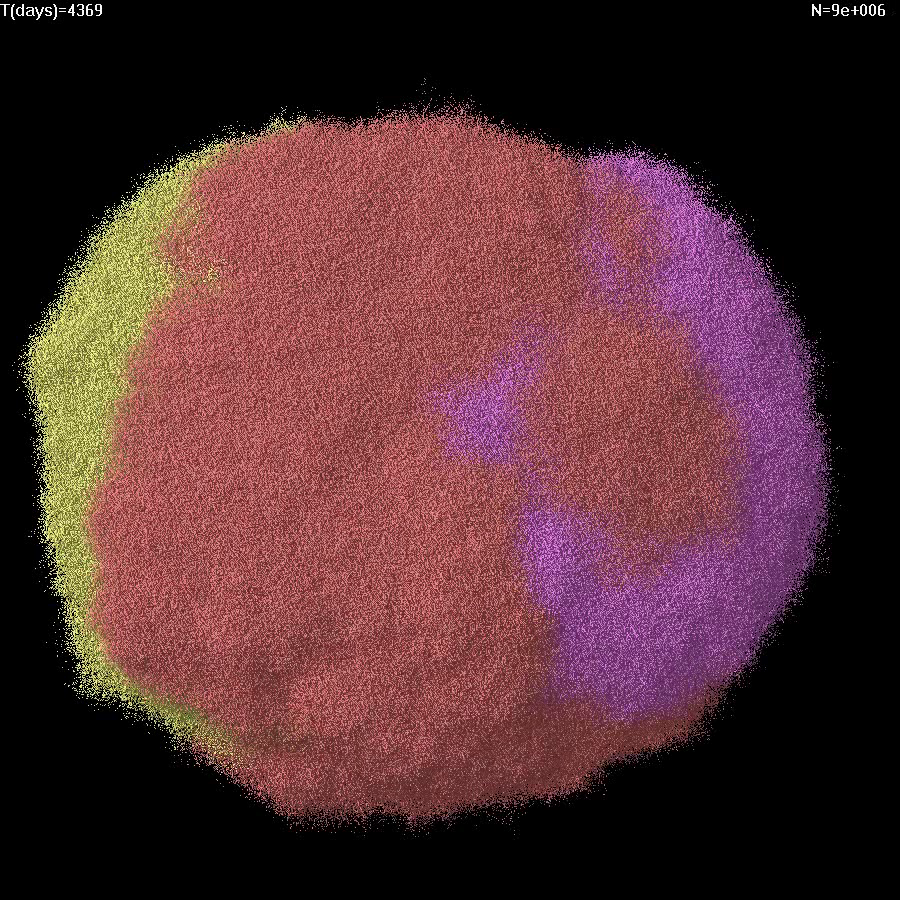
Simulation of growth of a small tumor (1e7 cells) with low migration M=1e-6 and death rate d=0.5. Different colors correspond to cells with different GAs. |
| 4 |
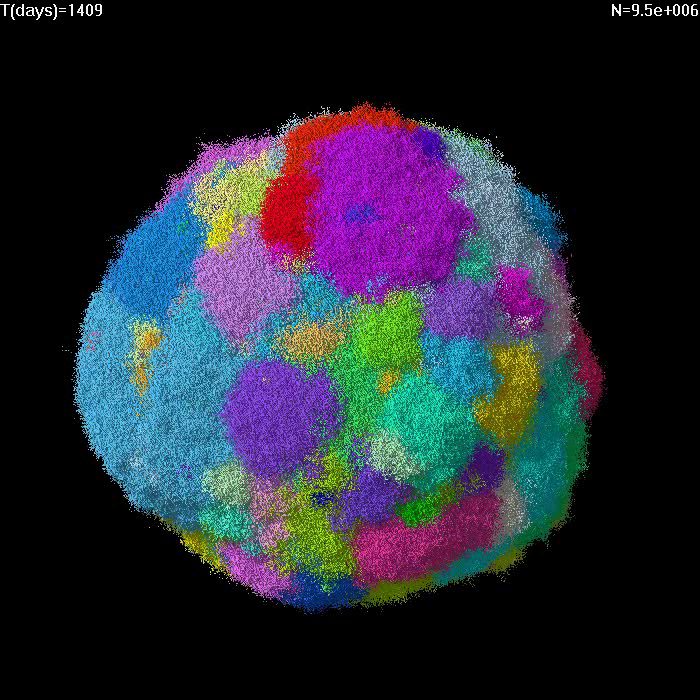 |
Simulation of growth of a small tumor (1e7 cells) with no migration and selective advantage of driver mutations s=5%. Different colors correspond to cells with different driver mutations. |
| 5 |
 |
Simulation of growth of a small tumor (1e7 cells) with no migration and selective advantage of driver mutations s=1%. Only three most-abundant driver mutations have been colored as in Fig. 4. |
| 6 |
 |
Simulation of growth and treatment of a small tumor (1e7 cells) for M=1e-6. Cells replicate and die only on the surface. Treatment begins at T=0. Different colors correspond to cells with different GAs. |
| 7 |
 |
Simulation of growth and treatment of a small tumor (1e7 cells) for no migration (M=0). Cells replicate and die only on the surface. Treatment begins at T=0. Different colors correspond to cells with different GAs. |
| 8 |
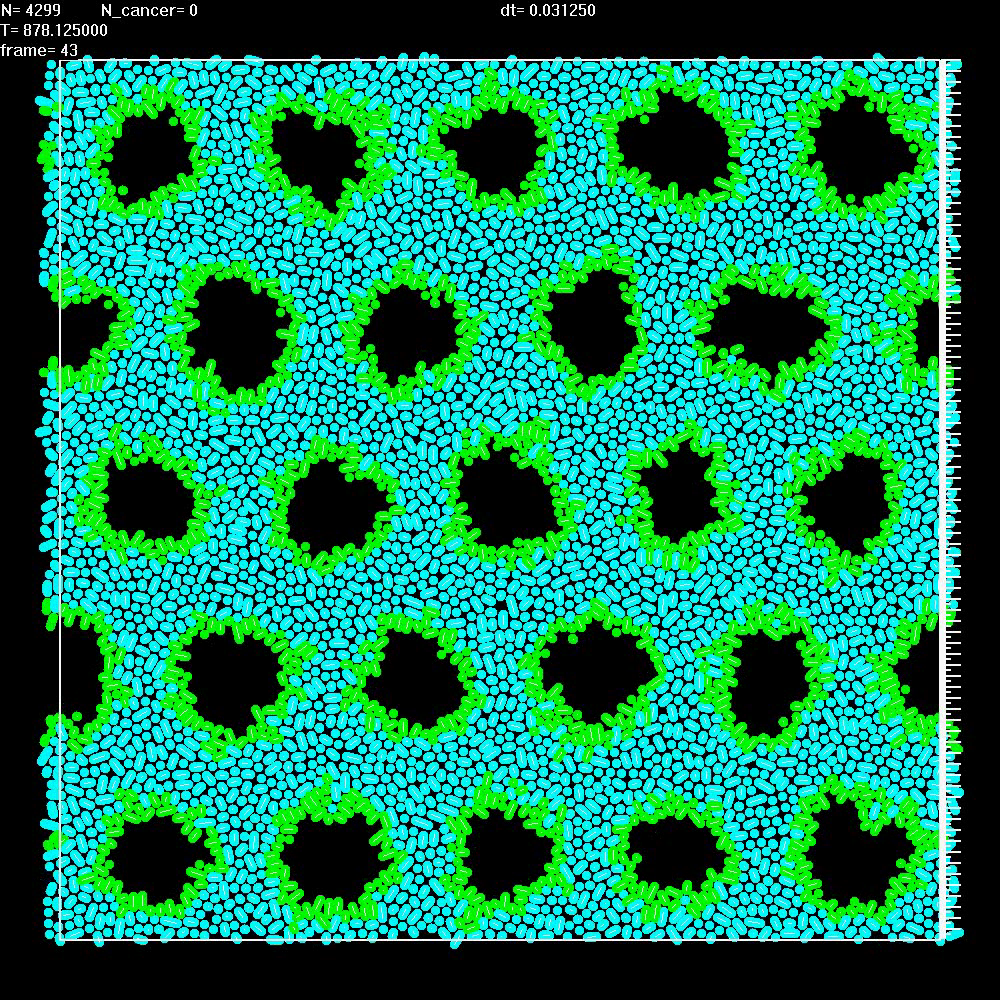 |
Simulation of a normal tissue with "ducts" (black areas) lined with epithelial cells (green) and separated by stroma (blue). The ducts, all of approximately equal diameter, have been arranged into a periodic array for simplicity. |
| 9 |
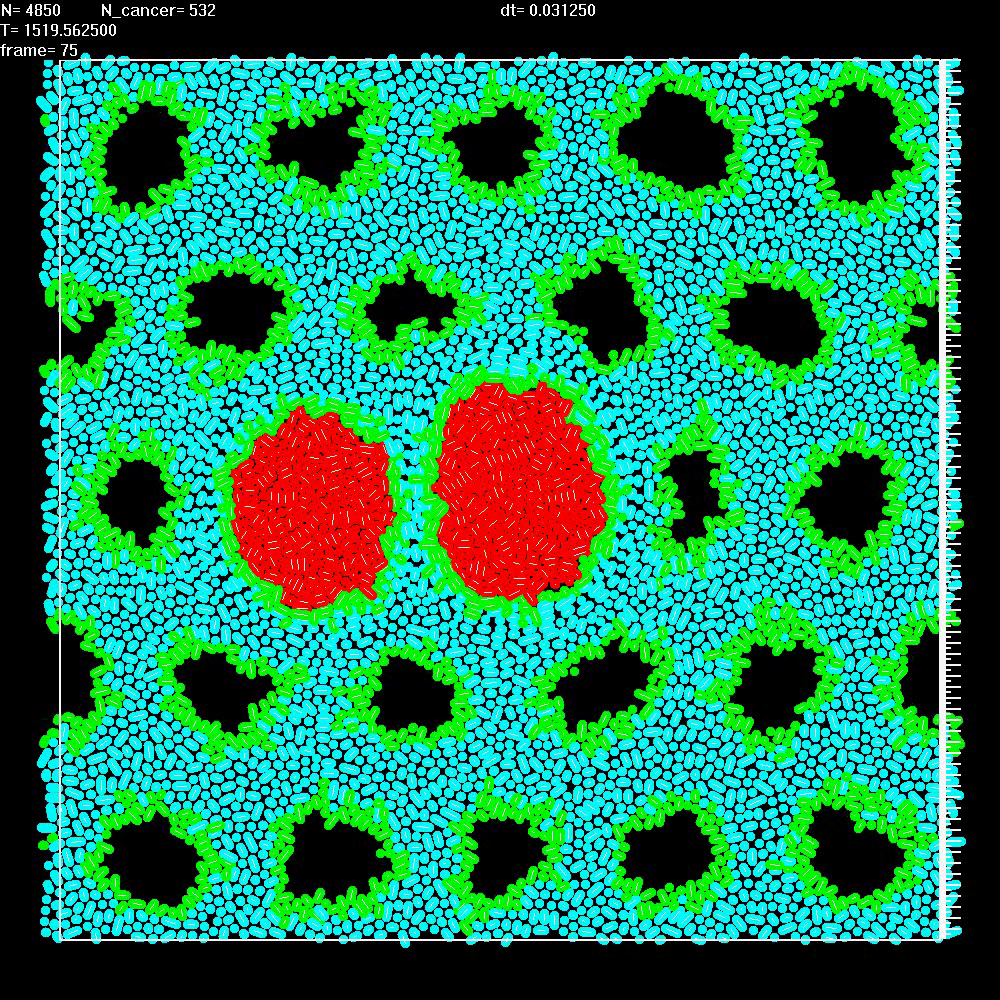 |
Simulation shows that when two balls of cancer cells (red) grow in two neighbouring ducts, they remain separated due to the presence of stroma. Expansion of the balls of cells causes compression of the nearby tissue. |
| 10 |
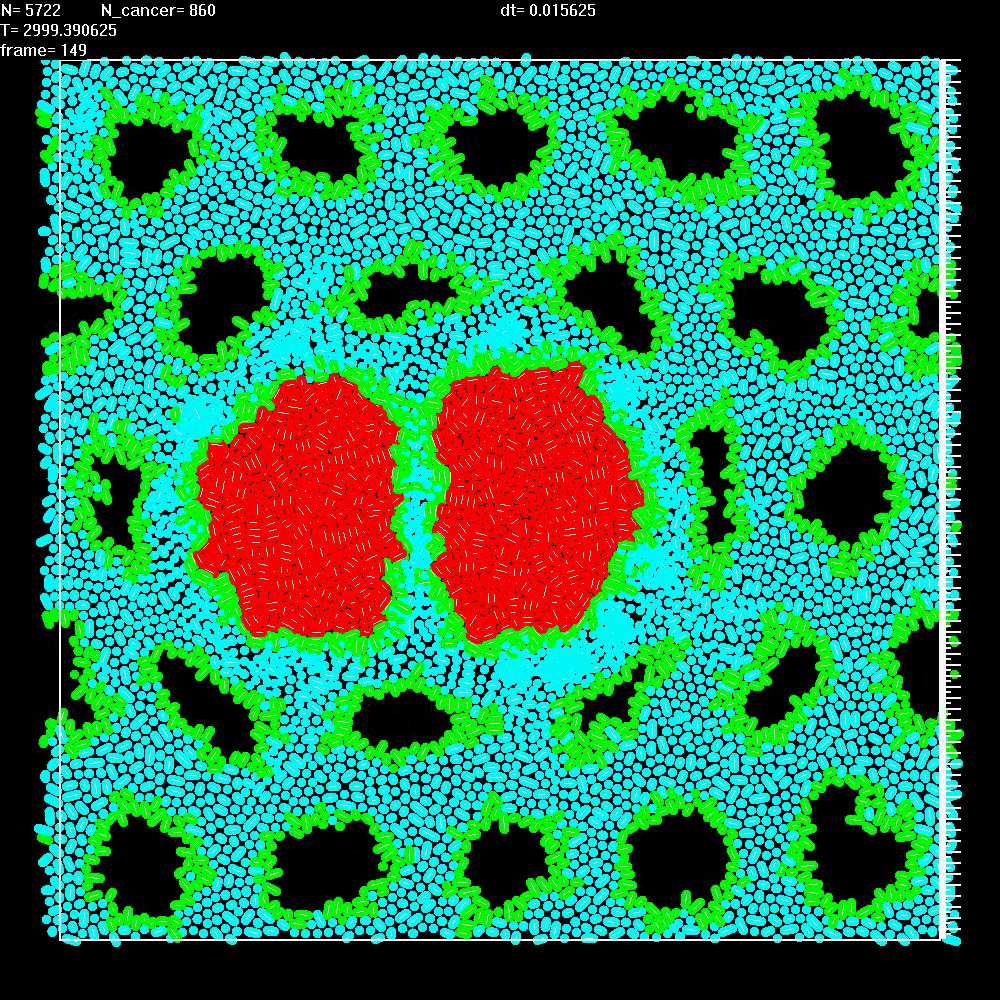 |
Simulation of two repelling balls of cells as in Video 9, but now mesenchymal cells (blue) embedded in ECM replicate in response to mechanical stretching of ECM. |
| 11 |
 |
Simulation of two repelling balls of cells as in Video 9, but this time ECM can break when stretched too much. |
| 12 |
 |
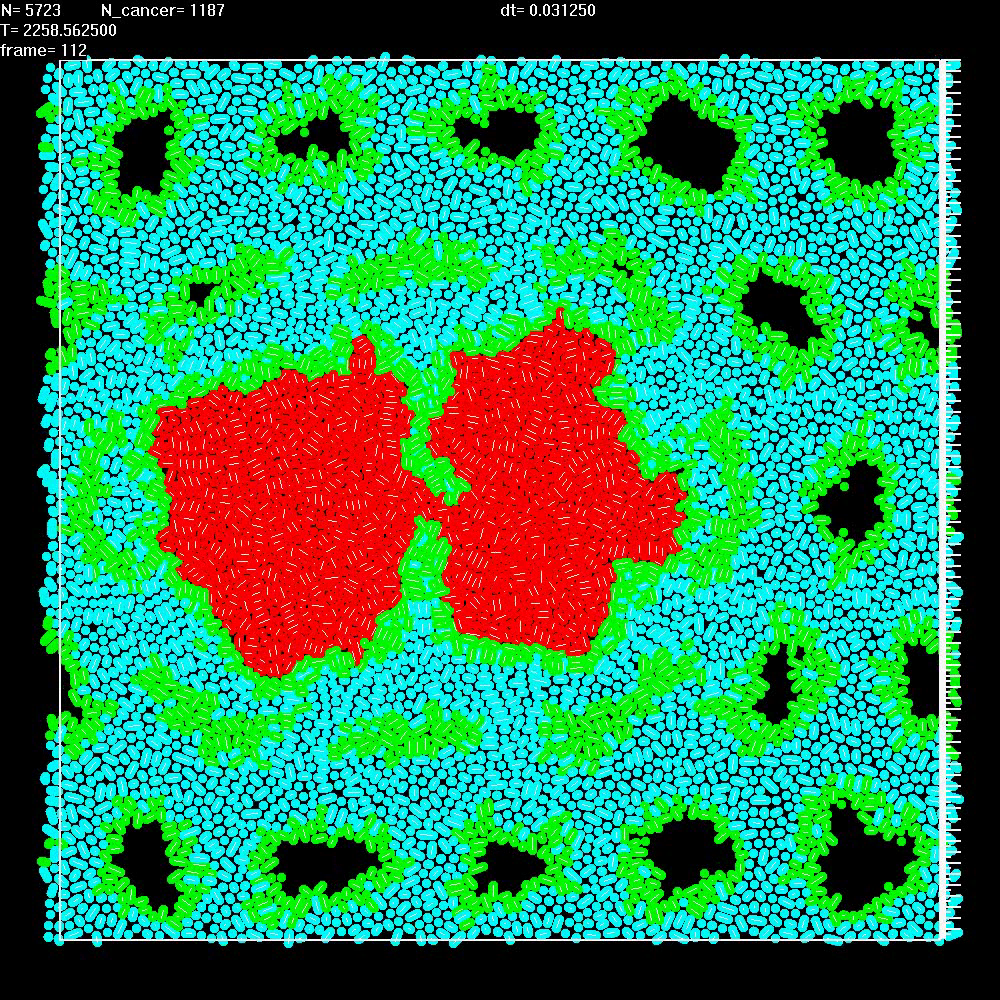
Simulation shows that when two neighbouring balls of cancer cells are not separated by stroma, they merge very quickly into a single ball. |
| 13 |
 |
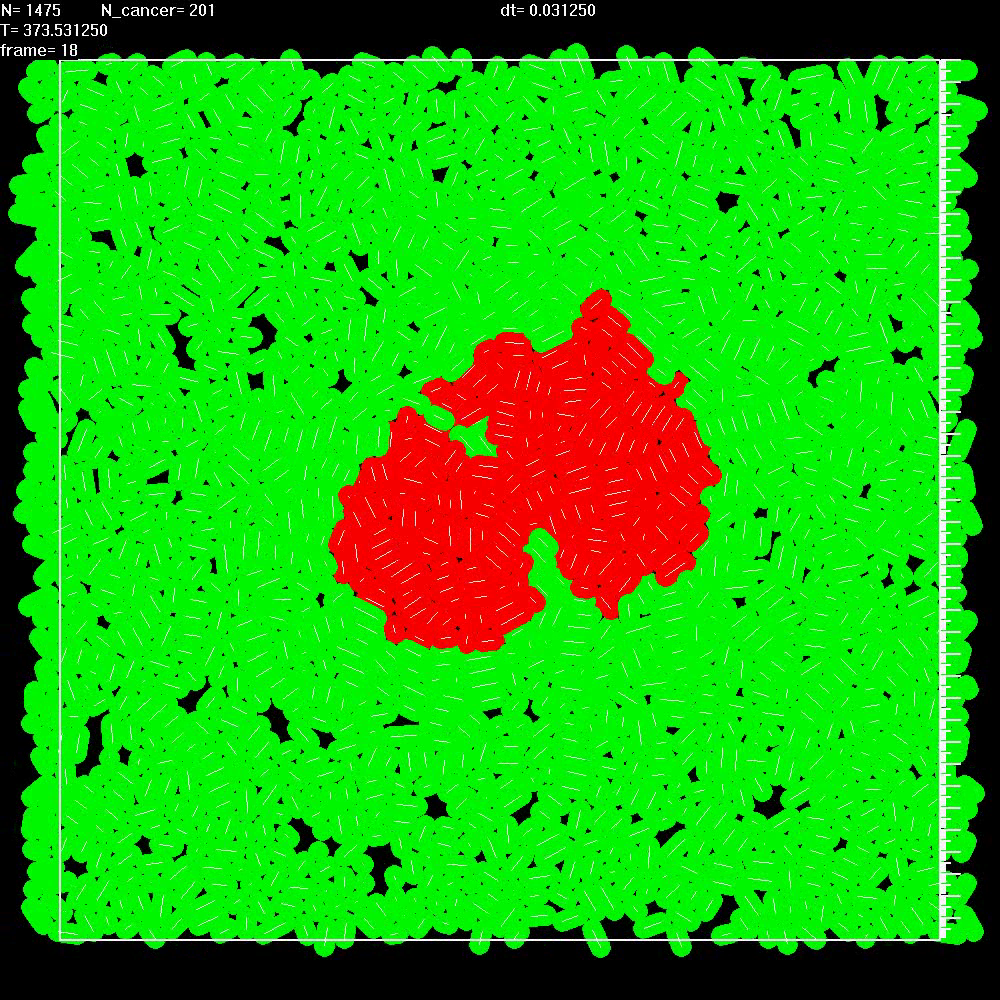
Simulation shows that migration of cancer cells (red) leads to a fast growth of the tumor, even in the absence of separated balls of cells. Here nutrients are provided only to the healthy tissue (green) and diffuse into the tumor. |
| 14 |
 |
Simulation shows that if, in contrast to Video 13, there is no migration, growth of the cancerous lesion is very slow. |