Phase Diagrams

 | Phase Diagrams |  |
Below is a list of phase diagrams that I have studied. As can be seen particles which have the same size ratio may not necessarily produce the same set of binary crystals and this shows how sensitive this process is to things such as individual particles size, polydispersity, gravitational settling etc etc.
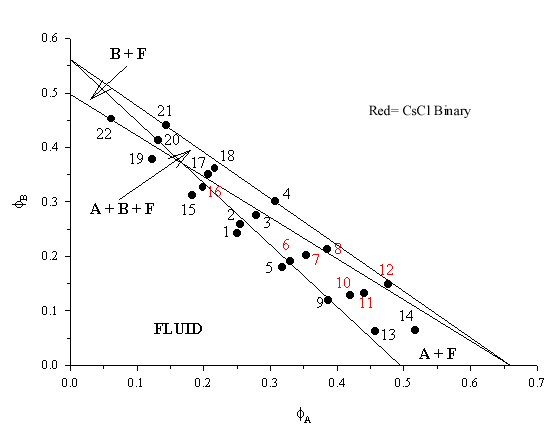 | This phase diagram was constructed using particles with a radii of 367.7nm and 270.6nm and the theoretical lines are taken from Hunt, Jardine, Bartlett Phys. Rev. E 62(1) 900 (2000). The binary crystals were found as two distinct sets with those in samples 7, 8, 10, 11 and 12 occurring as thin band near the top, or at the meniscus, of the sample while in 6 and 16 they occurred in a broad, sparcely populated central band. SEM images of the CsCl AB binary crystals can be seen on the SEM pages |
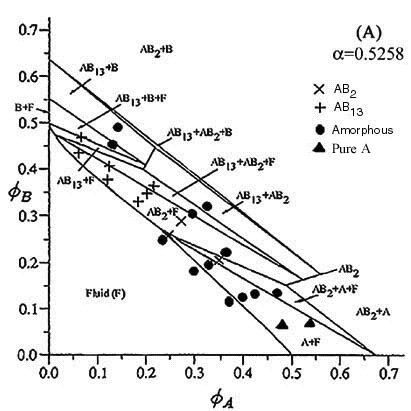 | This phase diagram was constructed using particles with a radii of 399.4nm and 210nm. As can be seen both the AB13 and AB2 binary crystals occured. The theoretical lines on the phase diagram are taken from Eldridge, Madden, Pusey, Bartlett Mol. Phys. 84(2) pg 395 (1995) |
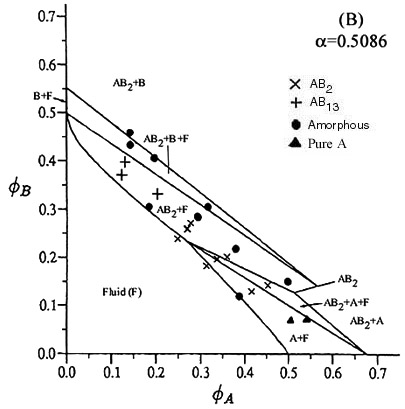 | The radii of the particles used to construct this phase diagram are 255.6nm and 130nm. Again both the AB13 and AB2 binary crystals occur. The theoretical lines on the phase diagram are taken from Eldridge, Madden, Pusey, Bartlett Mol. Phys. 84(2) pg 395 (1995) |
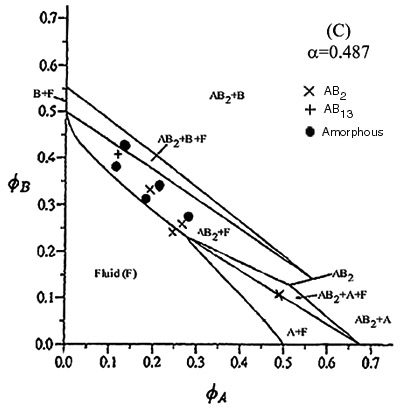 | This phase diagram was constructred using particles with radii of 267nm and 130nm. Both the AB13 and AB2 binary crystals occur and this is the lowest size ratio for which the AB13 crystal is seen. Theoretically this result was predicted by Eldridge, Madden and Frenkel (mol. phys. 80 987 (1993)). A laser light crystallography trace obtained from the AB13 crystal can be seen on the crystallography page. The theoretical lines on the phase diagram are taken from Eldridge, Madden, Pusey, Bartlett Mol. Phys. 84(2) pg 395 (1995). |
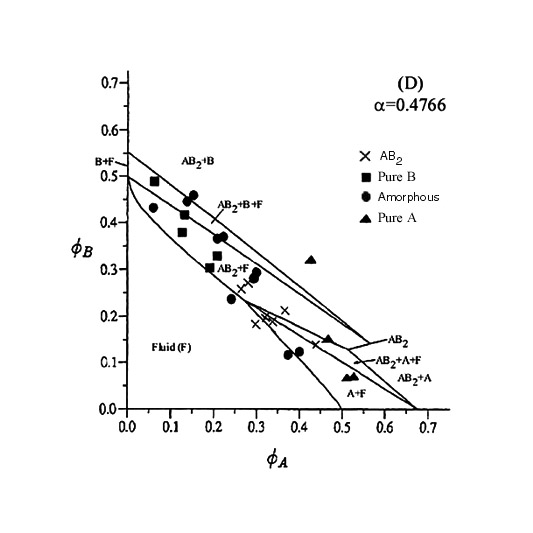 | This phase diagram was constructred using particles with radii of 440.6nm and 210nm. The only binary structure seen had the AB2 structure. Also several samples showed crystals of pure B particles which appeared in the upper half of the sample cells after a couple of months. This was put down to settling from the large A particles pushing the small B particles upwards and producing local regions within the sample that had concentrations large enough for crystallisation of this species to be favourable. The theoretical lines on the phase diagram are taken from Eldridge, Madden, Pusey, Bartlett Mol. Phys. 84(2) pg 395 (1995). |
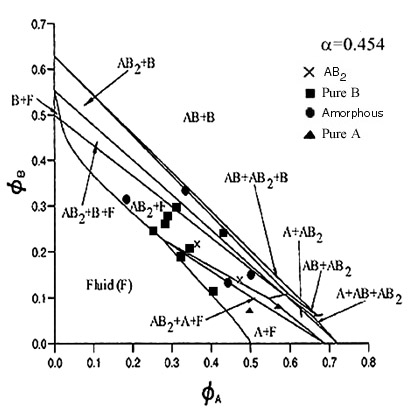 | The radii of the particles used to create this phase diagram were 462nm and 210nm. Again only AB2 binary crystals are seen as was the appearance of pure B crystals due to the settling out of the A particles. The theoretical lines on the phase diagram are taken from Trizac, Eldridge, Madden, Mol. Phys. 90(4) pg 675 (1997). |
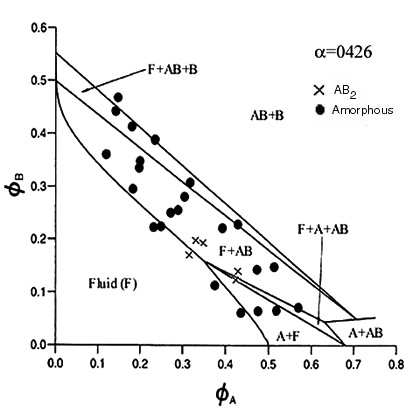 | This phase diagram was constructed using particles with radii of 324.7nm and 138.5nm. Again only the AB2 binary crystals are seen and this is the lowest size ratio at which this structure has been observed. Again this was predicted by Eldridge, Madden and Frenkel (mol. phys. 79 105 (1993)) as well as by Cottin and Monson (J Chem Phys 102(8) 3354 (1995)). A laser light crystallography trace for an AB2 binary crystal made from this system may be seen on the crystallography page. The theoretical lines on the phase diagram are taken from Trizac, Eldridge, Madden, Mol. Phys. 90(4) pg 675 (1997). |
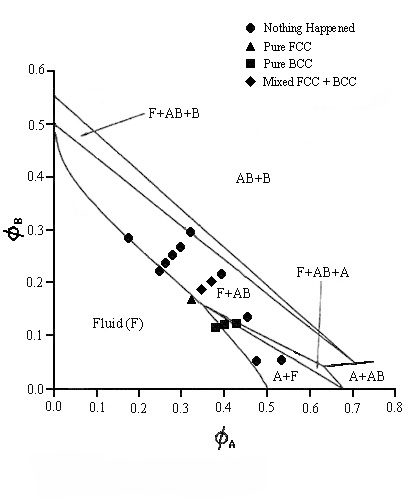 | This phase diagram is for a system containing particles with radii of 324.7nm and 130nm. This is the first time that the AB2 binary crystal does not occur and instead two new binary structures appear. These have AB6 body-centred-cubic and an AB face-centred-cubic structures. The remarkable thing about the AB6 binary is that the crystals take less than 24 hours to form which is exceptionally fast for such structures. The theoretical lines on the phase diagram are taken from Trizac, Eldridge, Madden, Mol. Phys.90(4) pg 675 (1997). Laser light crystallography traces and SEM photographs of the AB6 B.C.C. binary structure can be seen on the relevant pages |
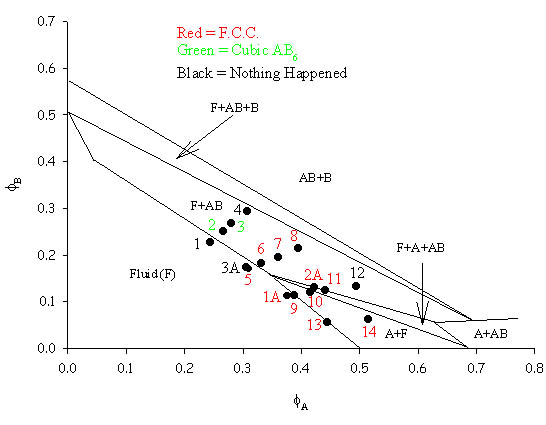 | This phase diagram was constructed using particles with radii of 415nm and 165.7nm. The predominant binary crystal structure found was that of face-centred-cubic (FCC) AB analogous to that seen in atomic NaCl and this was shown by both laser light crystallography and SEM. A cubic AB6 binary was also seen for two samples and again both laser light crystallography traces and SEM pictures for this structure can be seen on other pages. The theoretical lines on the phase diagram are taken from Trizac, Eldridge, Madden, Mol. Phys.90(4) pg 675 (1997). |
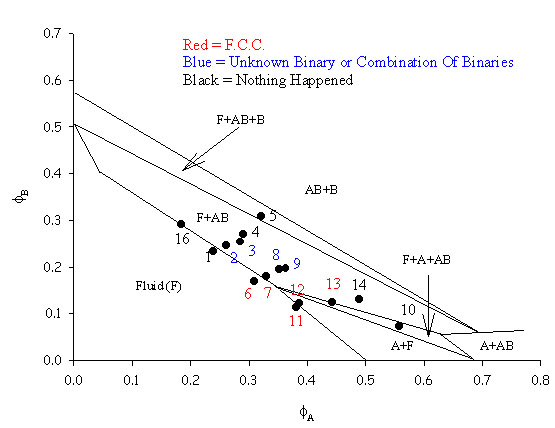 | To make a phase diagram with a size ratio of 0.3846 particles with radii of 338nm and 130nm were used. Again binary FCC AB crystals were seen along with a set of crystals which could not be classified. Hopefully further work will resolve this issue. The theoretical lines on the phase diagram are taken from Trizac, Eldridge, Madden, Mol. Phys.90(4) pg 675 (1997). |
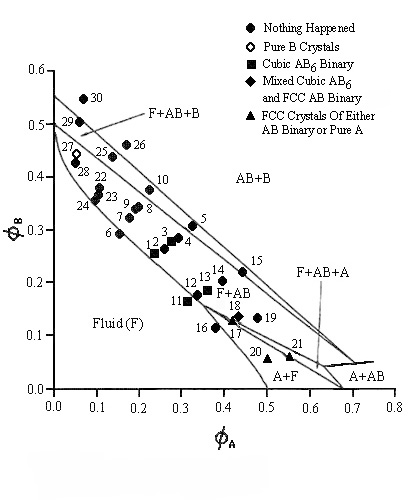 | For the phase diagram for the system with a size ratio of 0.356 the A particles had a radius of 387nm and the B particles a radius of 138.5nm. Only the cubic AB6 binary was found for this system. The theoretical lines on the phase diagram are taken from Trizac, Eldridge, Madden, Mol. Phys. 90(4) pg 675 (1997). |
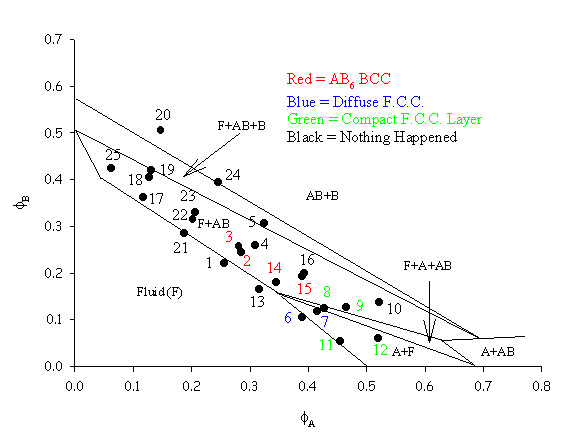 | This phase diagram was constructed using particles with radii of 424nm and 130nm. The difference noted between the two types of FCC crystal is a visual observation with the compact FCC forming a 'normal' looking layer within the sample and the diffuse FCC showing sparse crystals spread throughtout the sample. The AB6 binary took up to 5 months to form and the laser light crystallography data often showed that there might be either binary AB or single species A crystals also present in the samples. However, neither of these crystals were seen during SEM work and only the AB6 binary was seen using this technique. The theoretical lines on the phase diagram are taken from Trizac, Eldridge, Madden, Mol. Phys. 90(4) pg 675 (1997). |